What you learned:
Use DocsPlus Analytics
This is a printable summary
Overview

Use Analytics to see how a student has put together a piece of writing:
- Go to the Analytics ribbon tab.
- On the right is a chart showing how text has been entered into the document.
- On the left the words in the document are coloured according to how they were entered.
Drill down
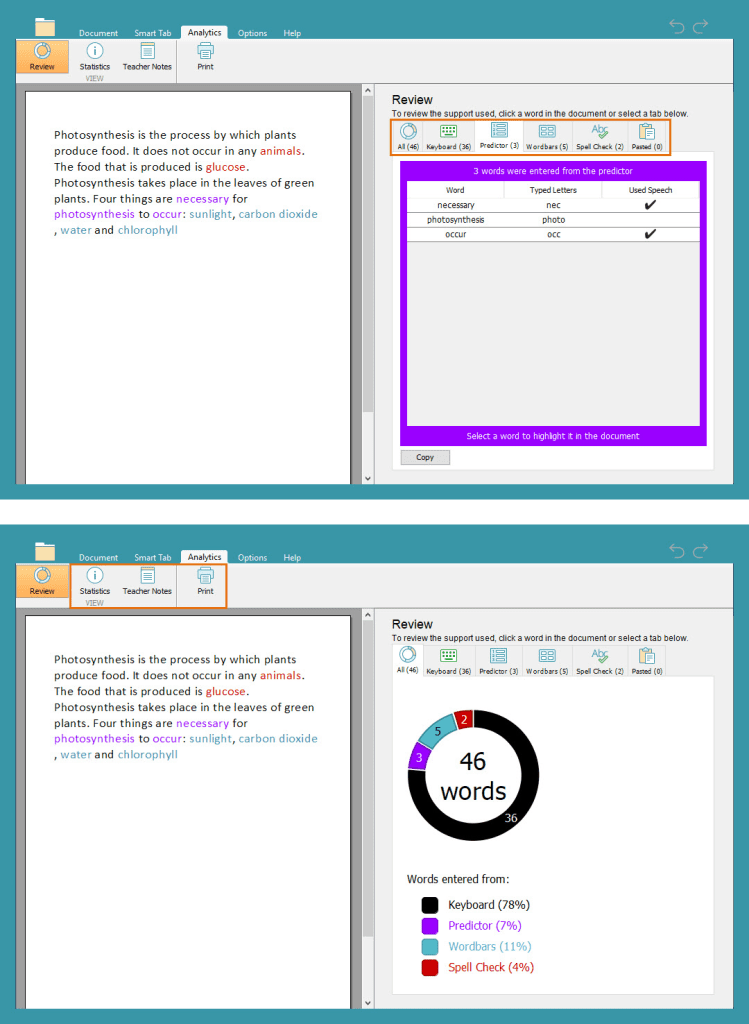
Get more detail about how each word was input:
- Use the tabs on the right to see all the words input from a particular source.
- Click words in the Document on the left to view more information on the right.
More tools in the Analytics ribbon:
- Click Statistics to see date and structure information.
- Click Teacher Notes to add or view notes.
- Click Print to print the document and Analytics.